
Kauai Real Estate Update- What properties Sold, were Just Listed or went into Escrow last week on the island of Kauai? Click on this link to access that information? Kauai Real Estate Update April 18 to 24, 2022
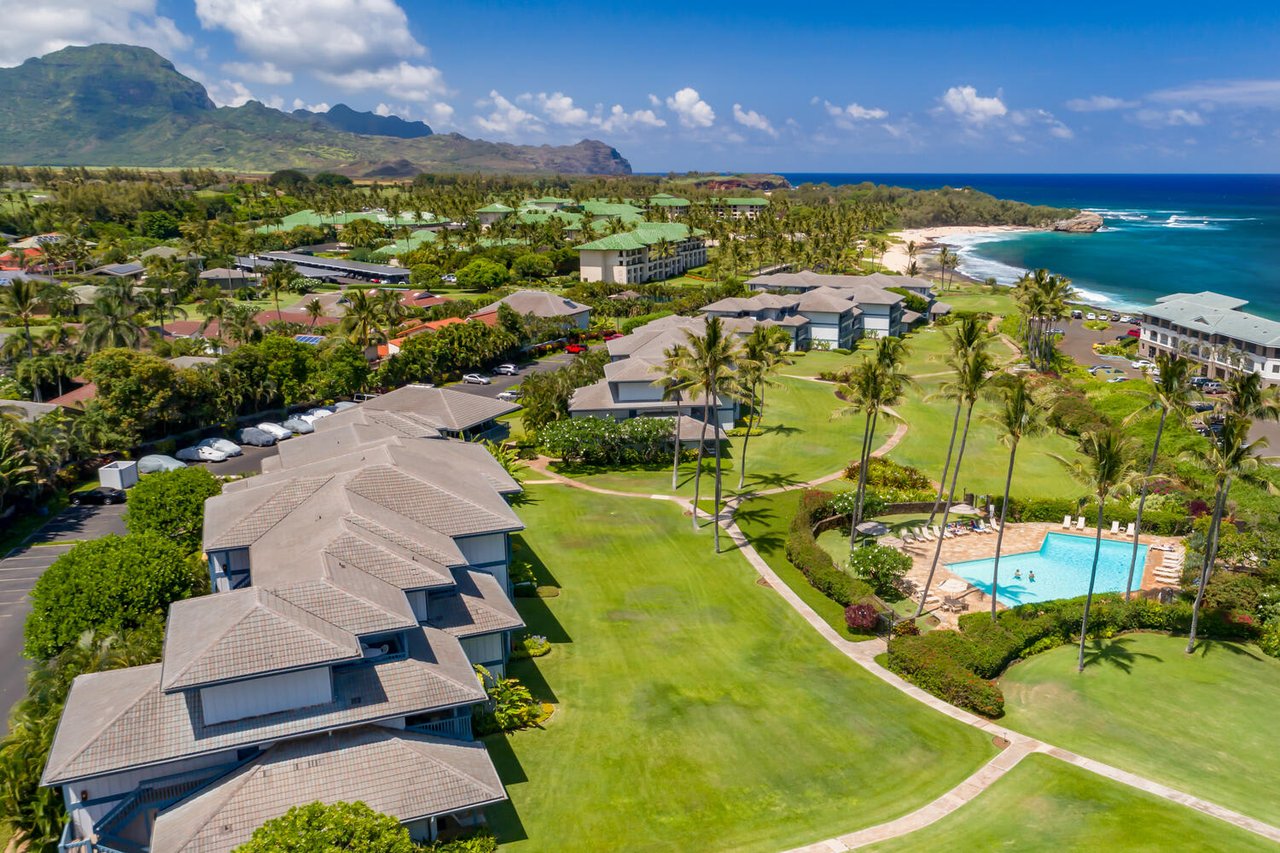
Poipu Beach Real Estate Update- For a Current Market Analysis for the Fee Simple properties in Poipu Beach click here: Poipu Beach Fee Simple Current Market Analysis
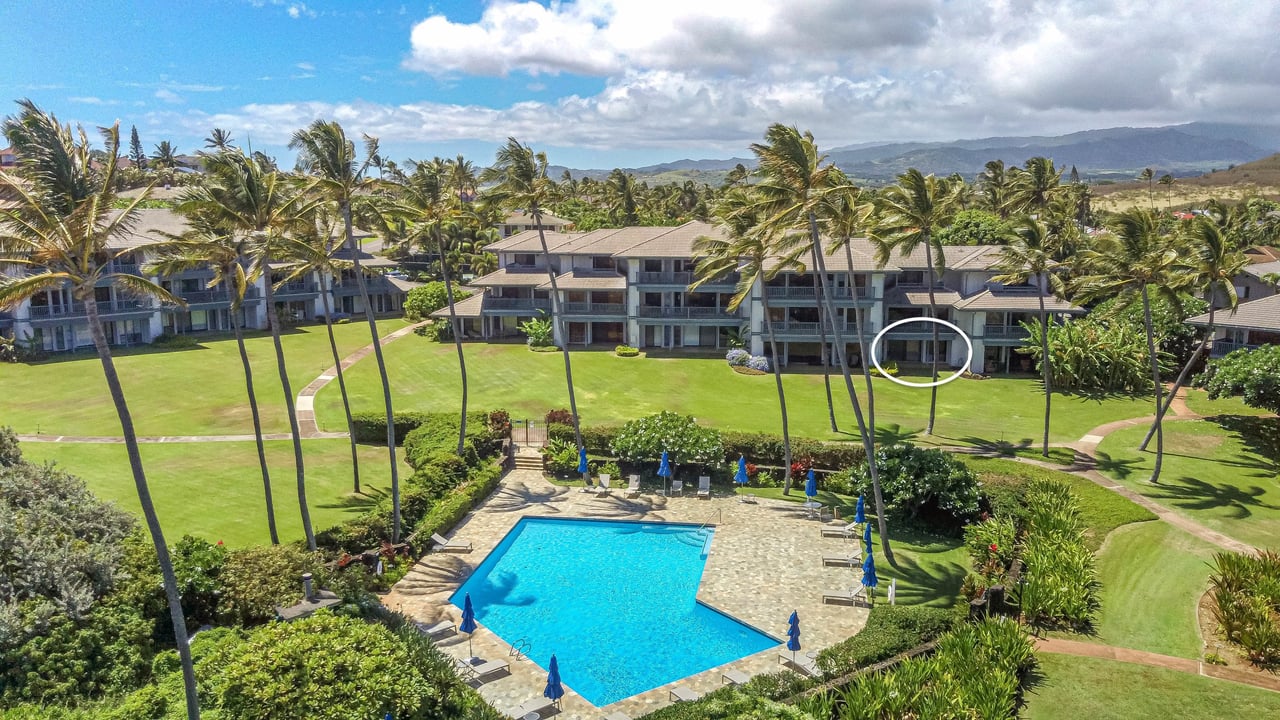
For the Kiahuna Plantation click here: Kiahuna Plantation Current Market Analysis
Kauai Quarterly Real Estate Report
This is a special real estate report which outlines the real estate activity for the first quarter of 2022. If you would like to know how this information pertains to your particular area of interest give me a call at 808-346-0056. Enjoy this special edition, I think you'll find this very informative.
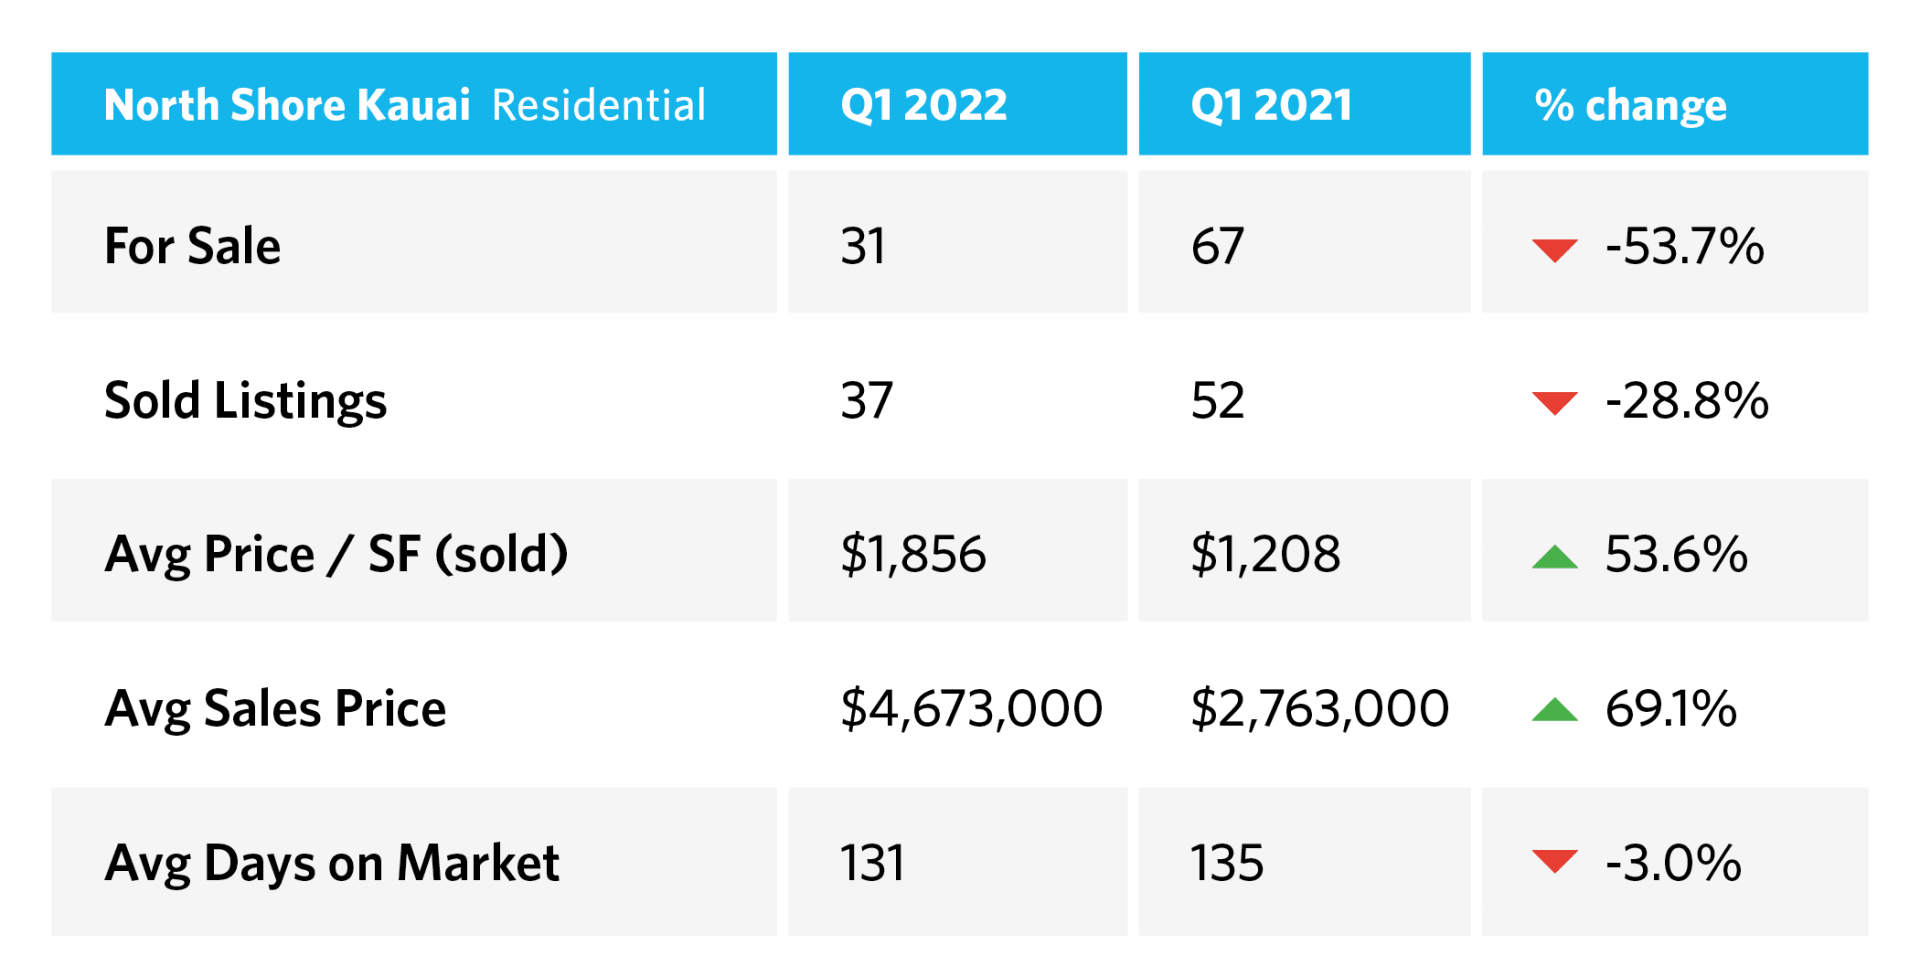
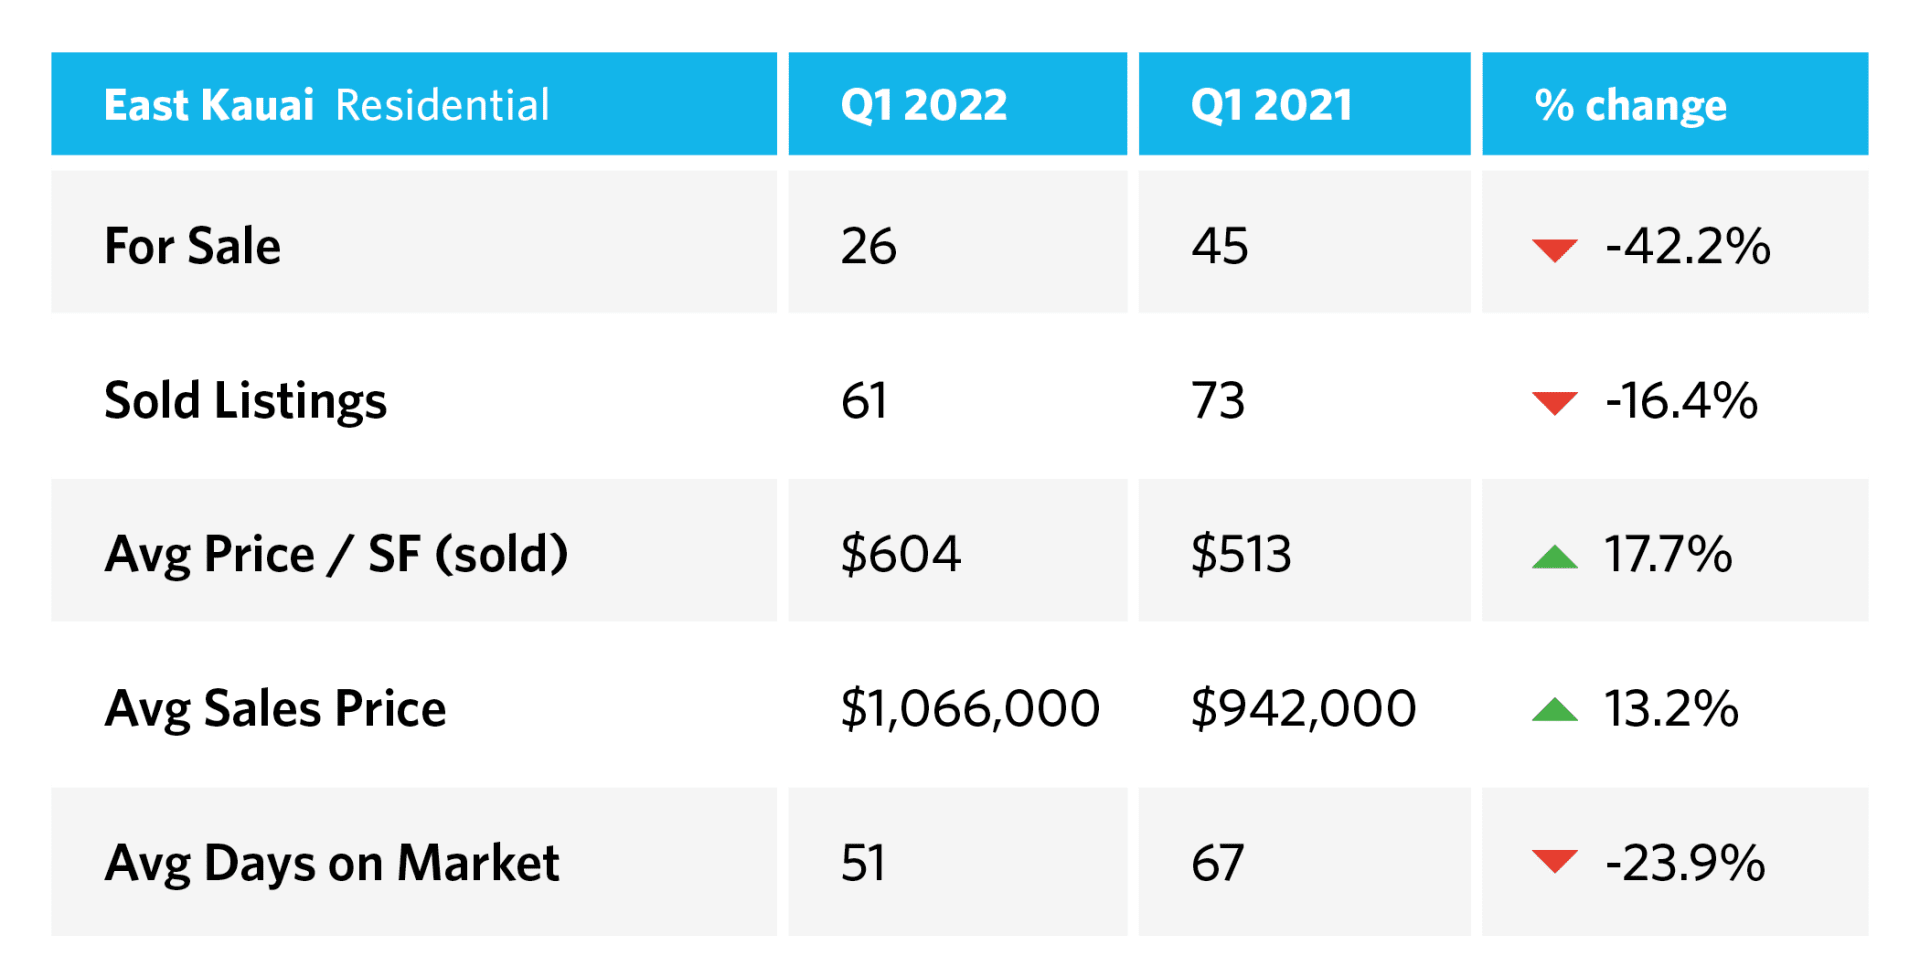
The first part is an overall picture of our market and at the end I've included submarket snapshots for the South Shore, North Shore and the East Side.
Kauai Real Estate Market Report, Q1 2022
Presented by Lynda Gill, REALTOR(S) 63088 | (808) 346-0056

Q1 2022 Reveals Shrinking Inventory and Climbing Prices: Faster Sales Strengthen Seller’s Market


Kauai Market Statistics Overview
Inventory
There are currently 80 active residential listings on Kauai, a decrease of -54%comparing Q1 2022 to Q1 2021. Number of homes available for sale have continued to decrease as inventory is absorbed at record rates and at record prices.
There were 149 sales on Kauai in Q1 2022, a decrease of -13.4% over 172 sales in Q1 2021.
Homes under contract are currently 169, a decrease of -2.3% over the same period last year, in which 173 homes were under contract in Q1 2021.

Average Sales Price
For the first quarter of 2022, the average sales price of single family homes on Kauai was $2.093M, an increase of +23% over the average sales price of $1.7M during Q1 2021.
Prices are holding, and continuing to rise, as inventory continues its downward trend.

Average Price Per Square Foot
Since Median Sold Price and Average Sold Price can be impacted by the mix of high or low end properties in the market, the Average Sold Price per Square Foot is a more normalized indicator on the direction of property values.
For Kauai, the average price per square foot has shown a steady increase over the last 12 months, with the year over year increase growing to $1,032/foot at the end of Q1 ‘22, an increase of +23% comparing Q1 2022 to Q1 2021.
Residential properties are commanding more value per square foot.

Days on Market
The average Days on Market (DOM) shows how many days the average property is on the market before it sells. The downward trend indicates a move towards more of a Seller’s market. While some of the previous 12 months have been outliers, the overall trendline shows that Days on Market is decreasing. Q1 2022 reported an average number of days on the market as 76 DOM, a decrease of -12% compared to 86 DOM Q1 2021.

Months of Inventory
Current months of inventory available is 1.8 months, a decrease of -40%comparing Q1 2022 to the first 3 months in Q1 2021.
The real estate market inventory on Kauai continues to be whittled down.